NGS VARIANTANALYSIS
WORKFLOW
NGS platforms
NGS instruments provide higher throughput at an
unprecedented speed by sequencing millions of short
DNA fragments in parallel [50, 51]. Currently, the
three most commonly used platforms are Roche 454
(introduced in 2005), Illumina (launched in 2006)
and ABI SOLiD (followed in 2008). All three platforms
sequence DNA by measuring and analyzing
signals, which are emitted during the creation of
the second DNA strand, but differ in how the
second strand is generated.
In order to produce detectable signals, template
DNA is fragmented into small pieces, amplified and
immobilized on a glass slide before sequencing.
Roche 454 implements pyrosequencing, which
measures released pyrophosphates allowing the analysis
of read fragments up to a few hundred base
pairs. Since this technique infers the number of
incorporated nucleotides from the signal’s intensity,
the system experiences problems when homopolymer
stretches longer than 8 bp are sequenced [52].
This complicates identification of small insertions and
deletions. Illumina applies a sequencing-by-synthesis
approach where only 1 nt per sequencing cycle is
incorporated using reversible dye terminators.
Thereby, it avoids homopolymer calling problems
at the cost of being capable of sequencing only
shorter fragments. ABI SOLiD analyzes DNA by
ligating fluorescently labeled di-base probes to the
first strand, requiring reading each base twice. Due
to the nature of this approach, identified calls are not
stored in nucleotide but in color space—a property
that needs to be considered in downstream analyses.
Depending on library preparation and sequencing
technology, it is possible to sequence reads that are of
a known chromosomal distance [26]. These so-called
paired-end or mate-pair reads provide additional information
which can be used for enhancing mapping
accuracy and identifying structural rearrangements
[53].
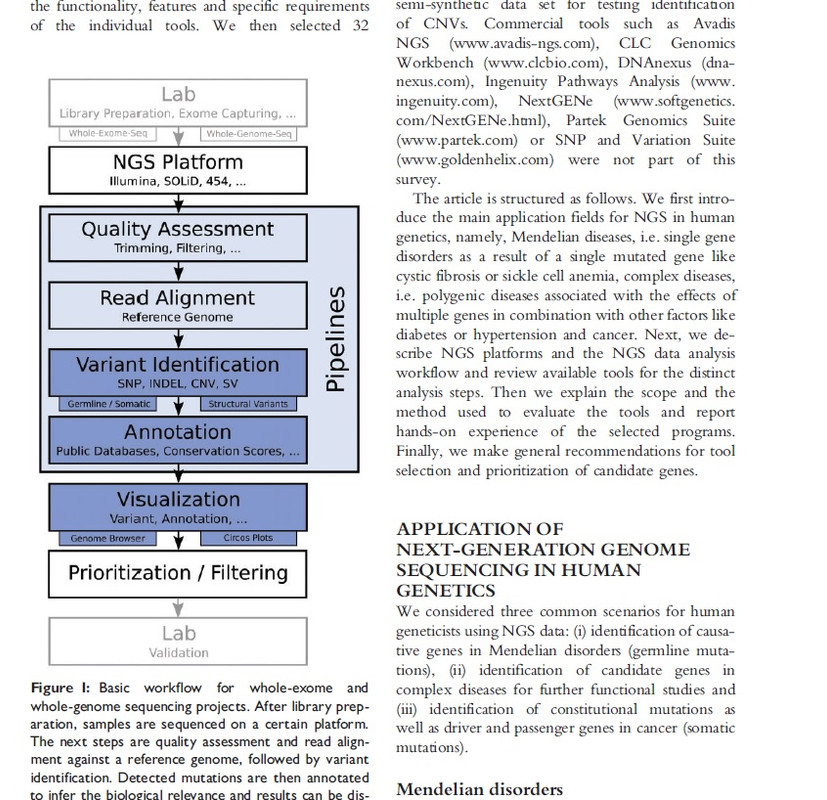
After completing laboratory work and the actual
sequencing, the researcher is confronted with a huge
amount of raw data. The analysis of the data can be
decomposed into five distinct steps (Figure 1): (i)
quality assessment of the raw data, (ii) read alignment
to a reference genome, (iii) variant identification, (iv)
annotation of the variants and (v) data visualization.
In the following paragraphs, we briefly explain each
of the steps and review available software tools. The
initial list of analysis tools was acquired by performing
multiple PubMed searches. Furthermore, we
conducted additional Internet searches to identify
tools not indexed by PubMed. An overview of the
surveyed tools is given in Supplementary Tables (see
also
icbi.at/ngs_survey).