|
|
Post by djoser-xyyman on Feb 15, 2020 18:23:09 GMT -5
Evaluation of Hair Density and Hair Diameter in the Adult Thai Population Using Quantitative Trichoscopic Analysis
Kanchana Leerunyakul1 and Poonkiat Suchonwanit 1
Show more
Academic Editor: Adam Reich
Abstract
The data of hair density and hair diameter in the Asian population, especially in Thais, are limited. We aimed to evaluate hair density and hair diameter of members of the Thai population at different scalp sites and to determine the effect of sex and aging as well as to compare the results with those in groups of other ethnicities. Healthy Thais whose hair examination findings were normal were evaluated. Two hundred and thirty-nine subjects participated in this study, of whom 79 were male and 160 were female. Hair density and hair diameter were analyzed at four different scalp sites using quantitative trichoscopic analysis. The highest hair density in Thais was observed in the vertex area. Hair densities at four different scalp sites were significantly different from one another; only hair density at the vertex site showed no significant difference from that in the occipital area. In contrast, hair diameter did not show any statistically significant differences for the different sites. We observed decreased mean hair density with increasing age and found statistically significant differences between participants in their 20s and those in their 60s, while hair diameter remained consistent. Comparing our results with a previous study in other ethnicities, the hair densities in Asians are generally lower. In conclusion, hair density in the Thai population varies at different scalp sites. Aging is a factor in declining hair density. Asians have a lower hair density compared to Caucasian and African populations.
|
|
|
|
Post by djoser-xyyman on Feb 15, 2020 18:10:54 GMT -5
Cattle, Pigs and now the Goats
Genome-wide diversity and demographic dynamics of Cameroon goats and their divergence from east African, north African, and Asian conspecifics
Getinet Mekuriaw Tarekegn 2020
Abstract
Indigenous goats make significant contributions to Cameroon’s national and local economy, but little effort has been devoted to identifying the populations. Here, we assessed the genetic diversity and demographic dynamics of Cameroon goat populations using mitochondrial DNA (two populations) and autosomal markers (four populations) generated with the Caprine 50K SNP chip. To infer genetic relationships at continental and global level, genotype data on six goat populations from Ethiopia and one population each from Egypt, Morocco, Iran, and China were included in the analysis. The mtDNA analysis revealed 83 haplotypes, all belonging to haplogroup A, in Cameroon goats. Four haplotypes were shared between goats found in Cameroon, Mozambique, Namibia, Zimbabwe, Kenya, and Ethiopia. Analysis of autosomal SNPs in Cameroon goats revealed the lowest HO (0.335 ±0.13) and HE (0.352±0.15) in the North-west Highland and Central Highland populations, respectively. Overall, the highest HO (0.401±0.12) and HE (0.422±0.12) were found for Barki and Iranian goats, respectively. Barki goats had the highest average MAF, while Central Highland Cameroon goats had the lowest. Overall, Cameroon goats demonstrated high FIS. AMOVA revealed that 13.29% of the variation was explained by genetic differences between the six population groups. Low average FST (0.01) suggests intermixing among Cameroon goats. All measures indicated that Cameroon goats are closer to Moroccan goats than to other goat populations. PCA and STRUCTURE analyses poorly differentiated the Cameroon goats, as did genetic distance, Neighbor-Net network, and neighbor-joining tree analyses. The haplotype analysis of mtDNA showed the initial dispersion of goats to Cameroon and central Africa from north-east Africa following the Nile Delta. Whereas, the approximate Bayesian computation indicated Cameroon goats were separated from Moroccan goats after 506 generations in later times (~1518 YA), as supported by the phylogenetic net-work and admixture outputs. Overall, indigenous goats in Cameroon show weak phylogenetic structure, suggesting either extensive intermixing.
|
|
|
|
Post by djoser-xyyman on Feb 13, 2020 6:17:19 GMT -5
BTW. As I said. I am still on the fence about Africans in the America, Still not sure who is Mansa Musa. But there are facts that needs to be explained but there may a 1000 different "stories" that can be made up. Pick one.
There seems to be an African presence in the Americas prior to Columbus. If Indonesian women can sale to Africa to meet black men. Why can't African men sail to the Americas to meetup with Native American women or African women sail to the Americas.
|
|
|
|
Post by djoser-xyyman on Feb 13, 2020 6:05:39 GMT -5
Repeat. SPECULATION AND FAIRY TALES ASIDE
The Facts are.....
---
From the study...this will oodly your noodles
quote
"Among the European Y chromosomes, none were found to belong to haplogroups J and T
previously reported to have high frequencies in Portuguese Jews
(>50%) [7]. I"
Another lie by Europeans. No Portuguese Jews entered STP or Cape Verde. All lies by European Historians that we are so eager to believe.
|
|
|
|
Post by djoser-xyyman on Feb 12, 2020 13:14:29 GMT -5
I am not sure where I am going with this but there is mounting evidence. If these researchers just do the right thing and conduct a open and honest genetic determination then this can be resolved but here is another piece the puzzle These so called runaway slaves carry some genetic material NOT FOUND in mainland Africans. The researchers are also suggesting mainland Africans carry more foreign admixture than these Colombian Africans. Is that true? ------- quote: However, San Basilio de Palenque population bear three
HLA -A, -B, -DRB1, -DQB1 extended haplotypes which are only found in this
population (Table 2, Supplementary Material). It may reflect that in the last 200-300 years Amerindian, European, African and Afro-American admixture has been scanty, compared to other Afro-Americans and even African populations. Social relationship with surrounding Colombian populations may have been limited by their pure African uses and culture, and even their unique Bantu-Spanish Creole speaking. In addition, it has been suggested that a majority of our sample individuals originated at Congo [16]. Finally, our HLA data support that this Afro- American group has received minimal gene flow [1], in spite of that new HLA-C
(hybrid?) alleles have been found in a Colombian Mestizo individual [17]. All genotype data included in this paper is held in www.allelefrequencies.net
which name is Colombia San Basilio de Palenque and identifier number is 3453[18]. |
|
|
|
Post by djoser-xyyman on Feb 12, 2020 6:40:07 GMT -5
Palenque de San Basilio in Colombia: genetic data support an oral history of a paternal ancestry in Congo
Naser Ansari-Pour,1 Yves Moñino,2 Constanza Duque,3 Natalia Gallego,4 Gabriel Bedoya,5 Mark G. Thomas,6 and Neil Bradman7
Abstract
The Palenque, a black community in rural Colombia, have an oral history of fugitive African slaves founding a free village near Cartagena in the seventeenth century. Recently, linguists have identified some 200 words in regular use that originate in a Kikongo language, with Yombe, mainly spoken in the Congo region, being the most likely source. The non-recombining portion of the Y chromosome (NRY) and mitochondrial DNA were analysed to establish whether there was greater similarity between present-day members of the Palenque and Yombe than between the Palenque and 42 other African groups (for all individuals, n = 2799) from which forced slaves might have been taken. NRY data are consistent with the linguistic evidence that Yombe is the most likely group from which the original male settlers of Palenque came. Mitochondrial DNA data suggested substantial maternal sub-Saharan African ancestry and a strong founder effect but did not associate Palenque with any particular African group. In addition, based on cultural data including inhabitants' claims of linguistic differences, it has been hypothesized that the two districts of the village (Abajo and Arriba) have different origins, with Arriba founded by men originating in Congo and Abajo by those born in Colombia. Although significant genetic structuring distinguished the two from each other, no supporting evidence for this hypothesis was found.
Keywords: Y chromosome, mitochondrial DNA, African diaspora, Atlantic slave trade, linguistic
|
|
|
|
Post by djoser-xyyman on Feb 12, 2020 6:24:34 GMT -5
Here is an interesting article. What they are concluding is that these "Africans" are genetically distinct from continental Africans and Aframs. They are speculating that they were runaway slaves. But this is "speculation" ie a story made-up to explain their presence in the Americas, BUT the FACTS. They are not closely related to West Africans and AFRAMS. With no European and American admixture. Note: Colombia and Brazil is on the EAst Coast facing Africa. Note also pre-historic Pacific Islander ancestry is found in Peru(West coast)
-------------------------------
The First Free Africans in America: HLA Study in San Basilio de Palenque
(Colombia)
ABSTRACT
Original San Basilio de Palenque population (North Colombia) fled from
Spanish traders that carried them as slaves and they founded in nearby Maria
mountains a fortified town (Palenque). They started helping new Africans
brought as slaves to flee and join them. Most of them spoke a Bantu-Congo
language and nowadays they speak the only one extant Bantu-Spanish Creole
language. Spanish Crown were forced to issue a decree declaring them free
(1691 AD), more than 100 years before than Haiti Republic existed****source???***. HLA-A, -B,
-DRB1 and -DQB1 alleles were studied and further computer procedures were
performed with Arlequin 3.5 software. No Amerindian or Europeans gene flow to
this population was found. However, three specific HLA extended haplotypes
are found in this population, which may reflect an isolation from other Africans
or Afro-Americans also. This may be due to the maintenance of their own
African culture, and even their unique Creole language.
They speak a unique language in the World: the only one extant
Bantu (Kongo or Kikongo)-Spanish Creole [7]. They showed Negroid phenotypes
and typical African culture. Generic HLA class I (-A and -B) was carried out by
serological typing and class II (-DRB1 and -DQB1) typing was performed by using
PCR-SSOP Luminex technique and ambiguities were resolved by direct DNA
sequencing, as referenced in [8].
------
|
|
|
|
Post by djoser-xyyman on Feb 12, 2020 6:02:18 GMT -5
“Latín” rock scripts in Canary Islands are ancient Iberian inscriptions (Iberian-Guanche) A story of forgotten genetics, scripts, pyramids and other prehistoric artifacts Antonio Arnaiz-Villena, Adrian Lopez-Nares, Ignacio Juárez, Valentín Ruizdel-Valle, Álvaro Callado, Alejandro H-Sevilla, Eduardo Gomez-Casado Abstract “Latin” rock scripts were discovered 30 years ago in Lanzarote and Fuerteventura Islands (Canary Islands). However, they are an incised linear writing which lacks Q, H, P and T frequent Latin letters and translation into Latin has not been possible. A transcription and a translation hypothesis was proposed long ago because scripts were almost identical to those of the Iberian semi-syllabary which was used in Iberia and France during first millennium BC; “Latin” scripts were named “IberianGuanche” and were mostly religious and funerary. This type of lineal incise writing is present in all seven Canary Islands and they may have been unnoticed because all other islands except Lanzarote and Fuerteventura are humid and covered by vegetation. This type of linear writings are, like Iberian, similar to Runes (Atlantic and Central Europe),Old Italian scripts (Raetian, Venetic, Lepontic, Etruscan) and Sitovo and Gradeshnistsa scripts (Bulgaria, 5th millennium BC). Language behind Iberian-Guanche scripts might be related to both Berber and Old Basque languages. People who wrote “Iberian-Guanche” inscriptions seem to be Canary Island inhabitants and not visitors. Genes (people) of present and past Canary Islanders are difficult only to assign to North Africa because gene flow between North Africa and Iberia existed in prehistoric times and it is difficult to distinguish Iberian and North African with Canarian gene profiles. Genetics by itself is not sufficient for relating people or specific for geography, this is firmly demonstrated for mitochondrial genes. Linguistics, Culture, and Archaeology are necessary to interpret population genetics data. Extant pyramids in North Africa, Western Sahara and possibly Tenerife, existence of prehistoric artifacts and rock calendars (“Quesera”/Cheeseborad lunisolar calendar at Lanzarote and others at Gran Canaria Island) and presence of Cart-Ruts on Lanzarote volcano tops, may indicate an older date for Canarian prehistory than that of Punic/Roman presence. Finally Canarian prehistoric findings have been long neglected and forgotten but a common IberianGuanche rock writing culture existed in Canary Islands. Keywords: Latin, Scripts, Canary Islands, Iberian, Guanche, Lybic, Lanzarote, Fuerteventura, Quesera, Cheeseboard, Pyramids, Berber, Africa, Punic, Roman, Western Sahara, Tunisia, Algeria, Canarian, Semi-Sillabary, Calendar, Raetian, Lepontic, Venetian, Etruscan, Basque, Cart-ruts, Sitovo, Gradeshnitsa, UskoMediterranean.  |
|
|
|
Post by djoser-xyyman on Feb 11, 2020 17:38:09 GMT -5
|
|
|
|
Post by djoser-xyyman on Feb 8, 2020 19:12:57 GMT -5
Here is another tool that may work.
Mining Whole Genome Sequence data to efficiently
attribute individuals to source populations
Francisco J. Perez-Reche ´
1,*, Ovidiu Rotariu2
, Bruno S. Lopes3
, Ken J. Forbes3
, and
Norval J.C. Strachan2
Computational time. The computational time for MMD is much shorter than STRUCTURE. Fig. 4(c) shows a comparison
of runtimes for self-attribution of Campylobacter isolates as a function of the number of SNP loci describing the genotypes.
The MMD is between 100 and 105
times faster than STRUCTURE for every run from 1 to ∼ 2×10⁴ SNPs. Since the running
time of MMD increases slowly with the number of loci compared to that of STRUCTURE, the efficiency of MMD improves
relative to that of STRUCTURE for extended genotypes. For instance, STRUCTURE takes ∼ 40h to assign a 25 937 cgSNP
genotype whereas MMD completes the task in ∼ 0.57 seconds (MMD implementation in R67, Processor: Intel® CoreTM
i7-3770 3.40GHz).
The MMD method is around twice as fast as ADMIXTURE when considering the 659 276 SNP dataset. More explicitly,
MMD takes ∼ 15 seconds to assign an individual whereas ADMIXTURE takes ∼ 38 seconds to infer the ancestry of one
individual (times based on an Intel® CoreTM i7-3770 3.40GHz processor for both algorithms).
Results
Source attribution with the MMD method
We propose the Minimal Multilocus Distance (MMD) method to estimate the probability pu,s
that an individual u is attributed
to a population source s based on the similarity between the genotype of the individual to be attributed and genotypes from the
sources. The similarity between pairs of genotypes is quantified by the Hamming distance which simply gives the number of
loci at which the genotypes differ64. The smaller the distance between genotypes, the larger the probability that they originate
from the same source (see Methods). To test the accuracy of the MMD method, we studied self-attribution, a cross-validation
method65, 66 which consists in removing individuals from the source population and estimating the probability that they are
correctly attributed to their source based on the remainder5, 12, 13, 51 (Fig. 2).
|
|
|
|
Post by djoser-xyyman on Feb 7, 2020 21:04:47 GMT -5
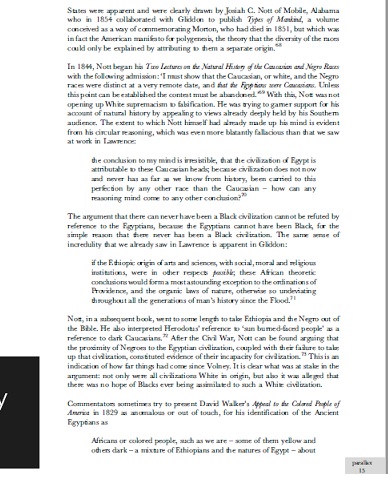
Original Articles Black Skin, White Skulls: The Nineteenth Century Debate over the Racial Identity of the Ancient Egyptians Robert Bernasconi Pages 6-20 | Published online: 22 May 2007 Download citation doi.org/10.1080/13534640701267123 |
|
|
|
Post by djoser-xyyman on Feb 7, 2020 20:59:00 GMT -5
|
|
|
|
Post by djoser-xyyman on Feb 7, 2020 13:04:44 GMT -5
Bump
|
|
|
|
Post by djoser-xyyman on Feb 7, 2020 12:27:54 GMT -5
So....Sage....how can the site grow when you are not sure what is the actual viewership. Not sure what the actual numbers are.
|
|
|
|
Post by djoser-xyyman on Feb 7, 2020 12:26:33 GMT -5
about 10 mins later this.....  |
|